Varroa 4
Monitoring for varroa in December - an 8-year experiment
In December for the years 2014 - 2021 all colonies were treated with oxalic acid by the trickle method (as described in Varroa 2 in the menu above) and the resulting mite drop for each colony monitored over a 5 day period.
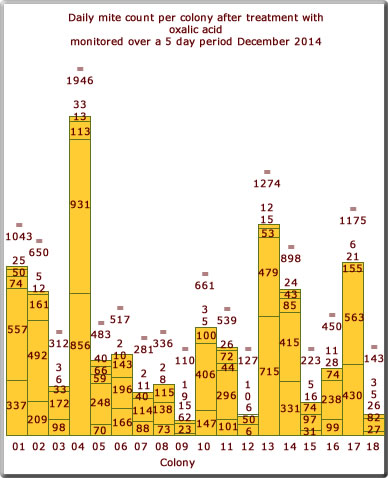
The total number of mites found in each colony is shown above the respective column.
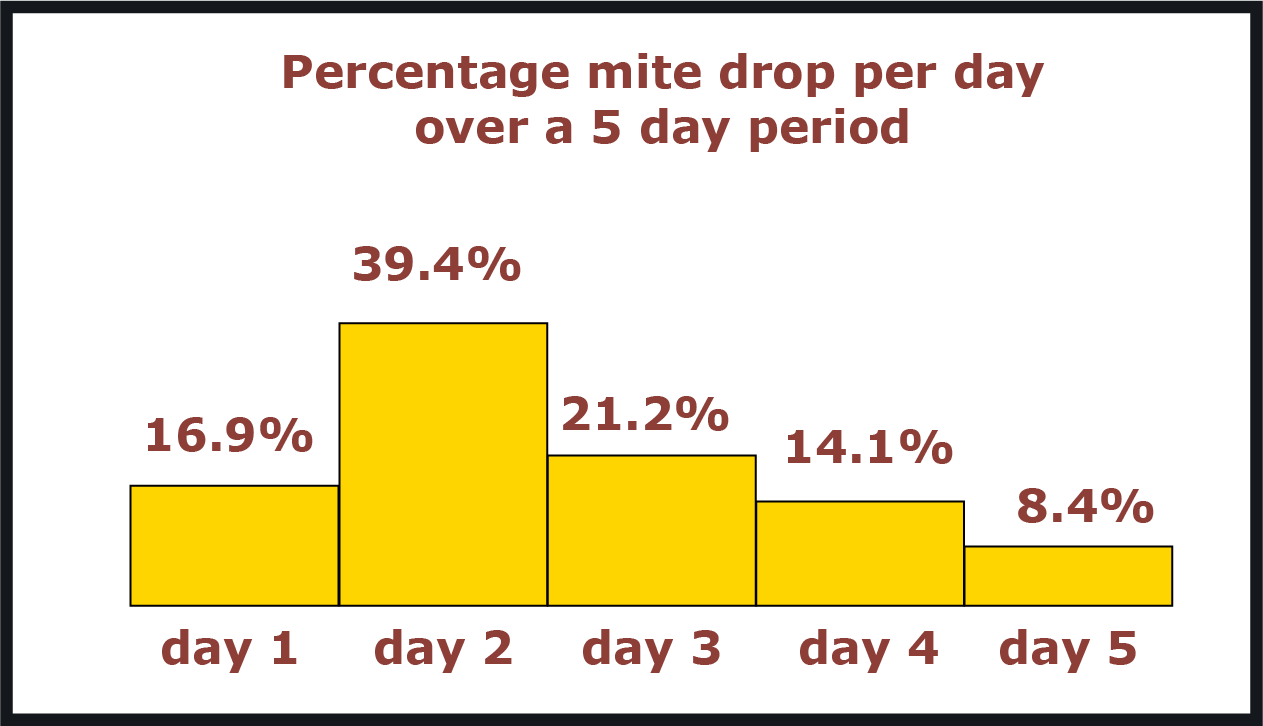
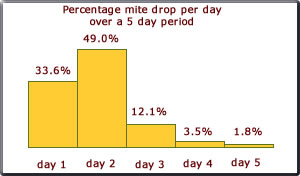
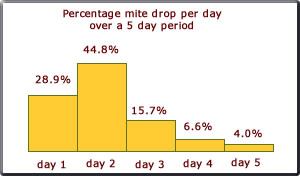
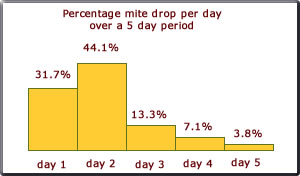
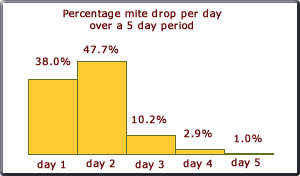
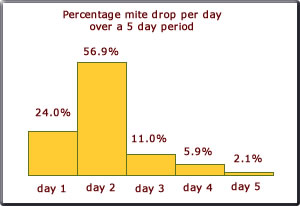
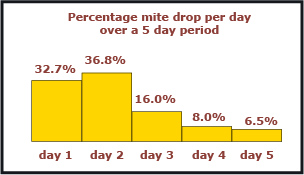
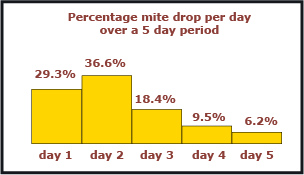
Also shown to the left of the results is a smaller bar chart which shows the percentage mite drop each day over the 5 day period. What is perhaps surprising is how these charts for the past 8 years are remarkably similar. Between 60% and 80% of the total mite drop occurs in the first 2 days showing how effective the oxalic acid is.
The total number of mites found in each colony is shown above the respective column.
Also shown to the left of the results is a smaller bar chart which shows the percentage mite drop each day over the 5 day period. What is perhaps surprising is how these charts for the past 8 years are remarkably similar. Between 60% and 80% of the total mite drop occurs in the first 2 days showing how effective the oxalic acid is.
December 2014
The bar chart on the right shows the results for 18 colonies in December 2014.
What was really surprising this year was generally the relatively high mite count compared to the two previous years. These results to some extent mirror the results found in August when the colonies were treated with formic acid.
What also appears to be surprising was the high mite counts for colonies 01, 02, 04, 13, 14, and 17 especially when these had been treated in August.
Perhaps the good weather experienced this summer and autumn provides the answer.
Were the mites able to have more brood cycles?
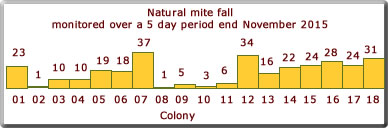
November 2015
The natural mite drop for 18 colonies was monitored over a 5 day period in late November just prior to treatment with oxalic acid. What is perhaps surprising is the fact that mites are still dropping even in this late season. This is explained when the results shown below are considered.
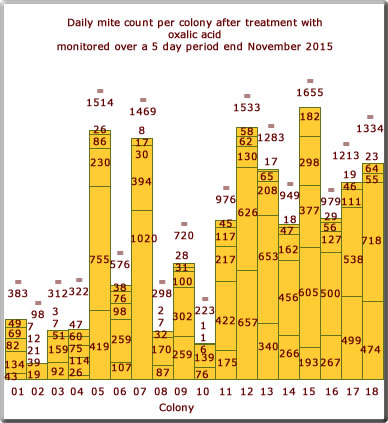
December 2015
The bar chart on the right shows the mite drop after treatment with oxalic acid.
Considering the fact that the mite count this year after treatment with formic acid in August was relatively low. A result that could be accounted for by the poor summer when monthly temperatures were well below the norm. This mite count was expected to again be on the low side.
However, the results are full of surprises. The amount of varroa in some colonies was very much higher than expected.
The scale of the the chart is the same as for that in 2014. So this year there was a significant increase in the varroa count. How to account for this? The temperatures this year for the summer months were lower than the average. Only in October and November were they above the norm. Perhaps the queen continued to lay longer this year hence an increased number of brood cycles for the mite?
The natural mite drop for 18 colonies was monitored over a 5 day period in late November just prior to treatment with oxalic acid. What is perhaps surprising is the fact that mites are still dropping even in this late season. This is explained when the results shown below are considered.
December 2015
The bar chart on the right shows the mite drop after treatment with oxalic acid.
Considering the fact that the mite count this year after treatment with formic acid in August was relatively low. A result that could be accounted for by the poor summer when monthly temperatures were well below the norm. This mite count was expected to again be on the low side.
However, the results are full of surprises. The amount of varroa in some colonies was very much higher than expected.
The scale of the the chart is the same as for that in 2014. So this year there was a significant increase in the varroa count. How to account for this? The temperatures this year for the summer months were lower than the average. Only in October and November were they above the norm. Perhaps the queen continued to lay longer this year hence an increased number of brood cycles for the mite?
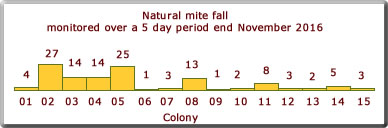
November 2016
The natural mite drop for 15 colonies was monitored over a 5 day period in late November just prior to treatment with oxalic acid. What is perhaps surprising in this instance is the relative small count for some colonies.
The natural mite drop for 15 colonies was monitored over a 5 day period in late November just prior to treatment with oxalic acid. What is perhaps surprising in this instance is the relative small count for some colonies.
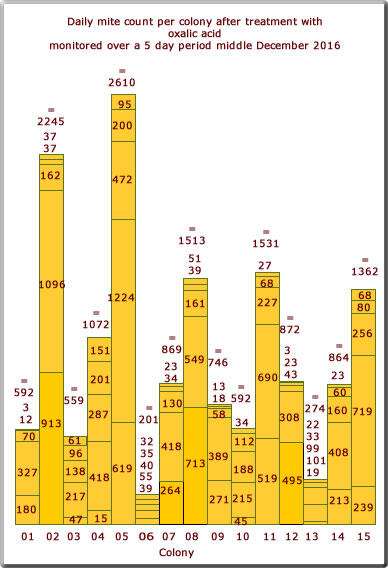
December 2016
The bar chart on the right shows the mite drop after treatment with oxalic acid over the 5 days. In view of the fact that these colonies were not treated with formic acid in August. it was not surprising that some colonies showed a relatively high mite count.
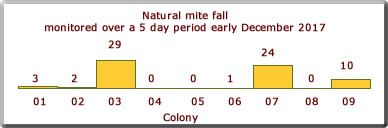
December 2017
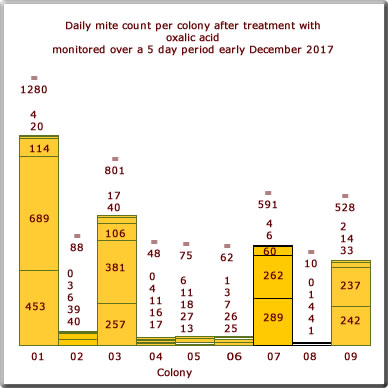
The natural mite drop for 9 colonies this year were monitored over a 5 day period in early December just prior to treatment with oxalic acid.
The bar chart on the right shows the daily mite count after treatment with oxalic acid over the 5 day period for the 9 hives. Colonies 01, 03, 07, and 09 show a relatively high mite count. Whereas colonies 02. 04, 05, 06, and 08 are much lower than expected. Whilst it is thought that all 9 colonies were of similar strength, it might well be that these latter colonies are relatively weak; hence the low mite count.
December 2018
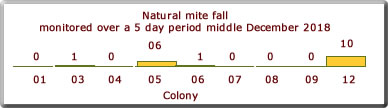
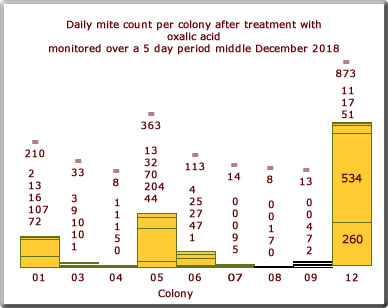
The natural mite drop for 9 colonies this year was monitored over a 5 day period in middle December just prior to treatment with oxalic acid.
The bar chart on the right shows the daily mite count after treatment with oxalic acid over the 5 day period for the 9 hives. Only colonies 01, 05, and 12 show a relatively high mite count.
What is perhaps pleasing is the relatively low mites counts found over the last two years compared to those of previous years.
December 2019
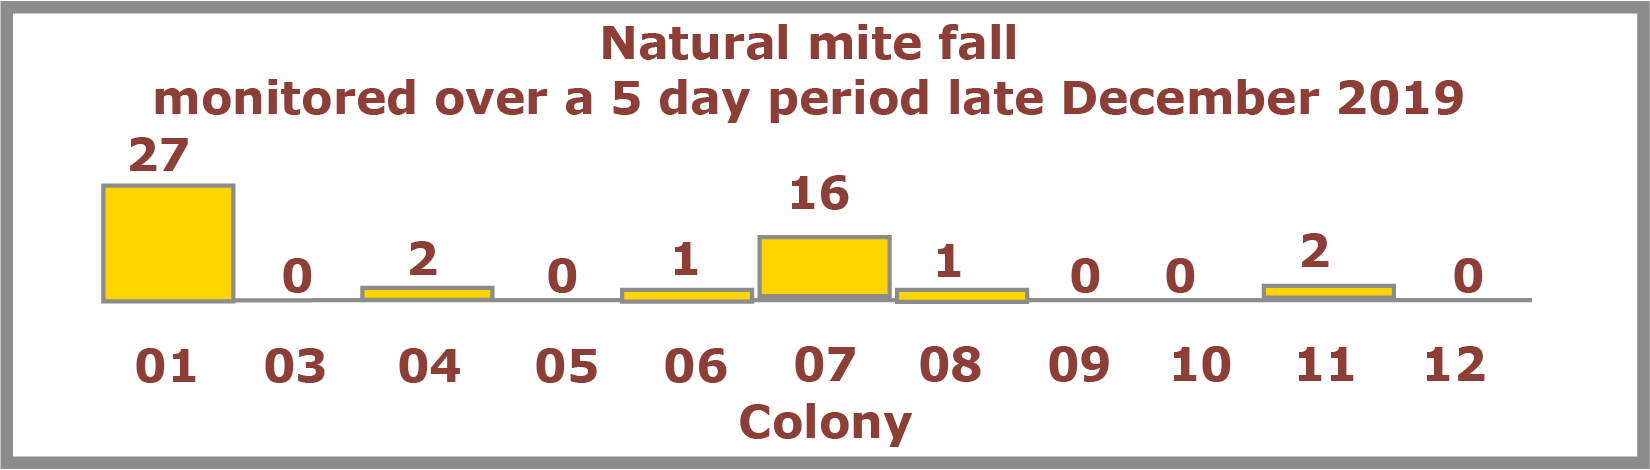
The natural mite drop for 11 colonies this year was monitored over a 5 day period in late December just prior to treatment with oxalic acid.
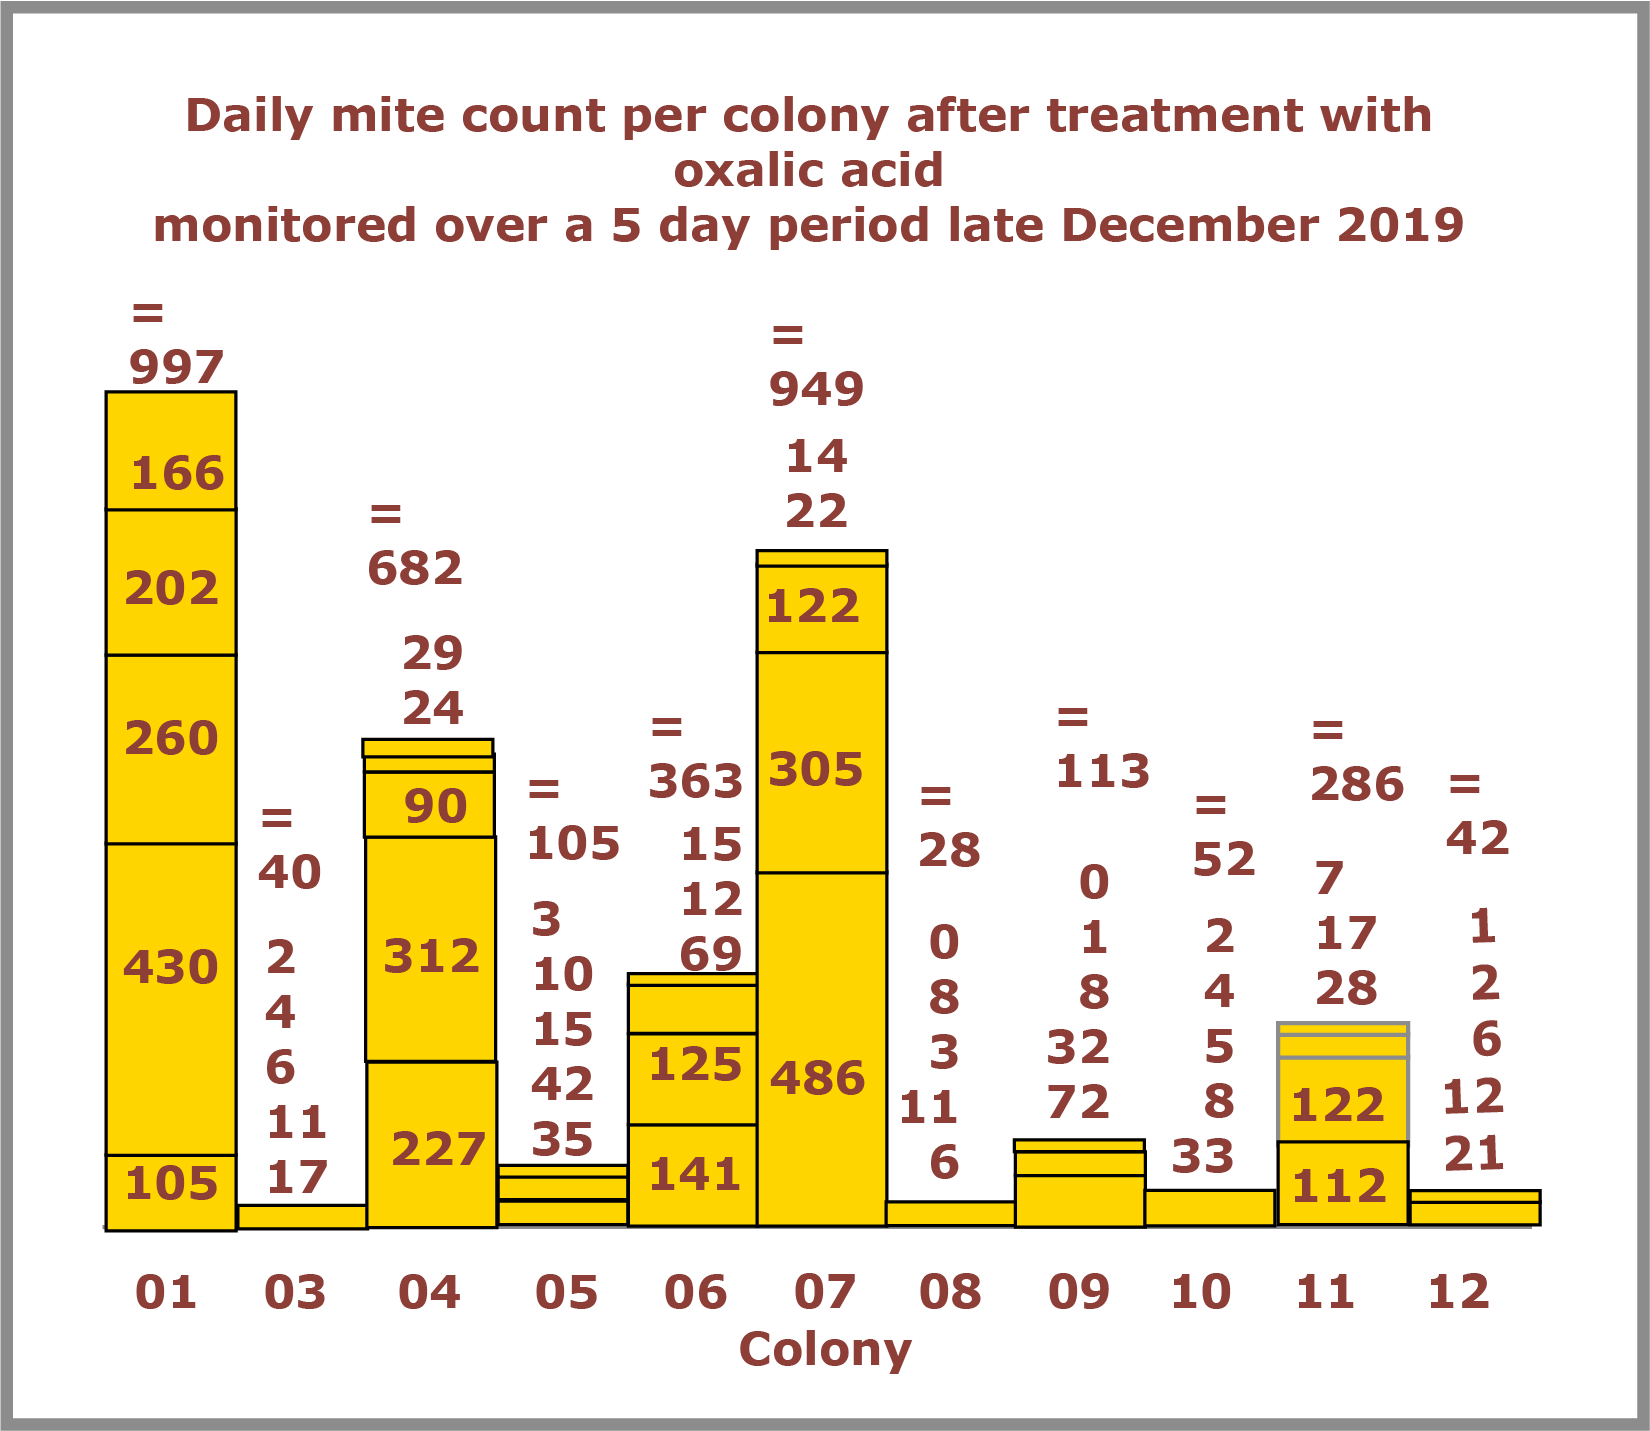
The bar chart on the right shows the daily mite count after treatment with oxalic acid over the 5 day period for the 11 hives.
The natural mite drop for 11 colonies this year was monitored over a 5 day period in late December just prior to treatment with oxalic acid.
The bar chart on the right shows the daily mite count after treatment with oxalic acid over the 5 day period for the 11 hives.
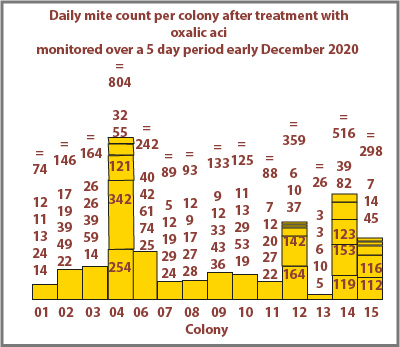
December 2020
The natural mite drop for 14 colonies this year was monitored over a 5 day period in early December just prior to treatment with oxalic acid.
The bar chart on the right shows the daily mite count after treatment with oxalic acid over the 5 day period for the 14 colonies.
Only 4 colonies showed a significant mite drop.

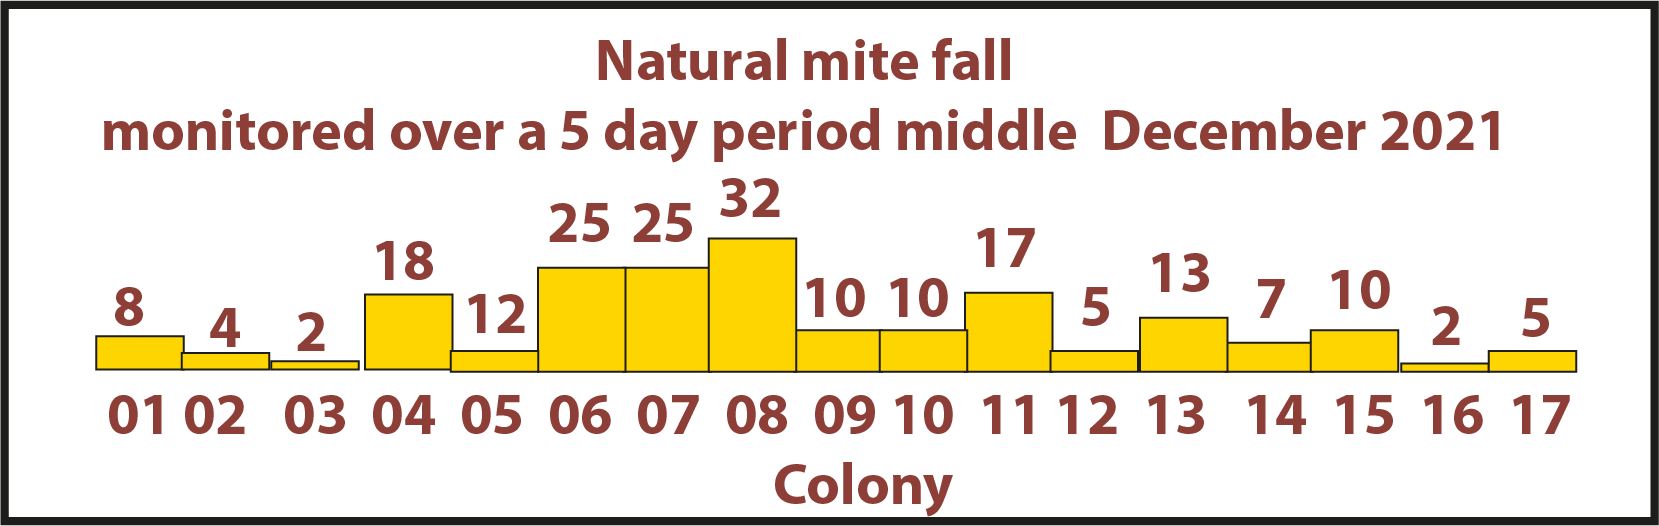
December 2021
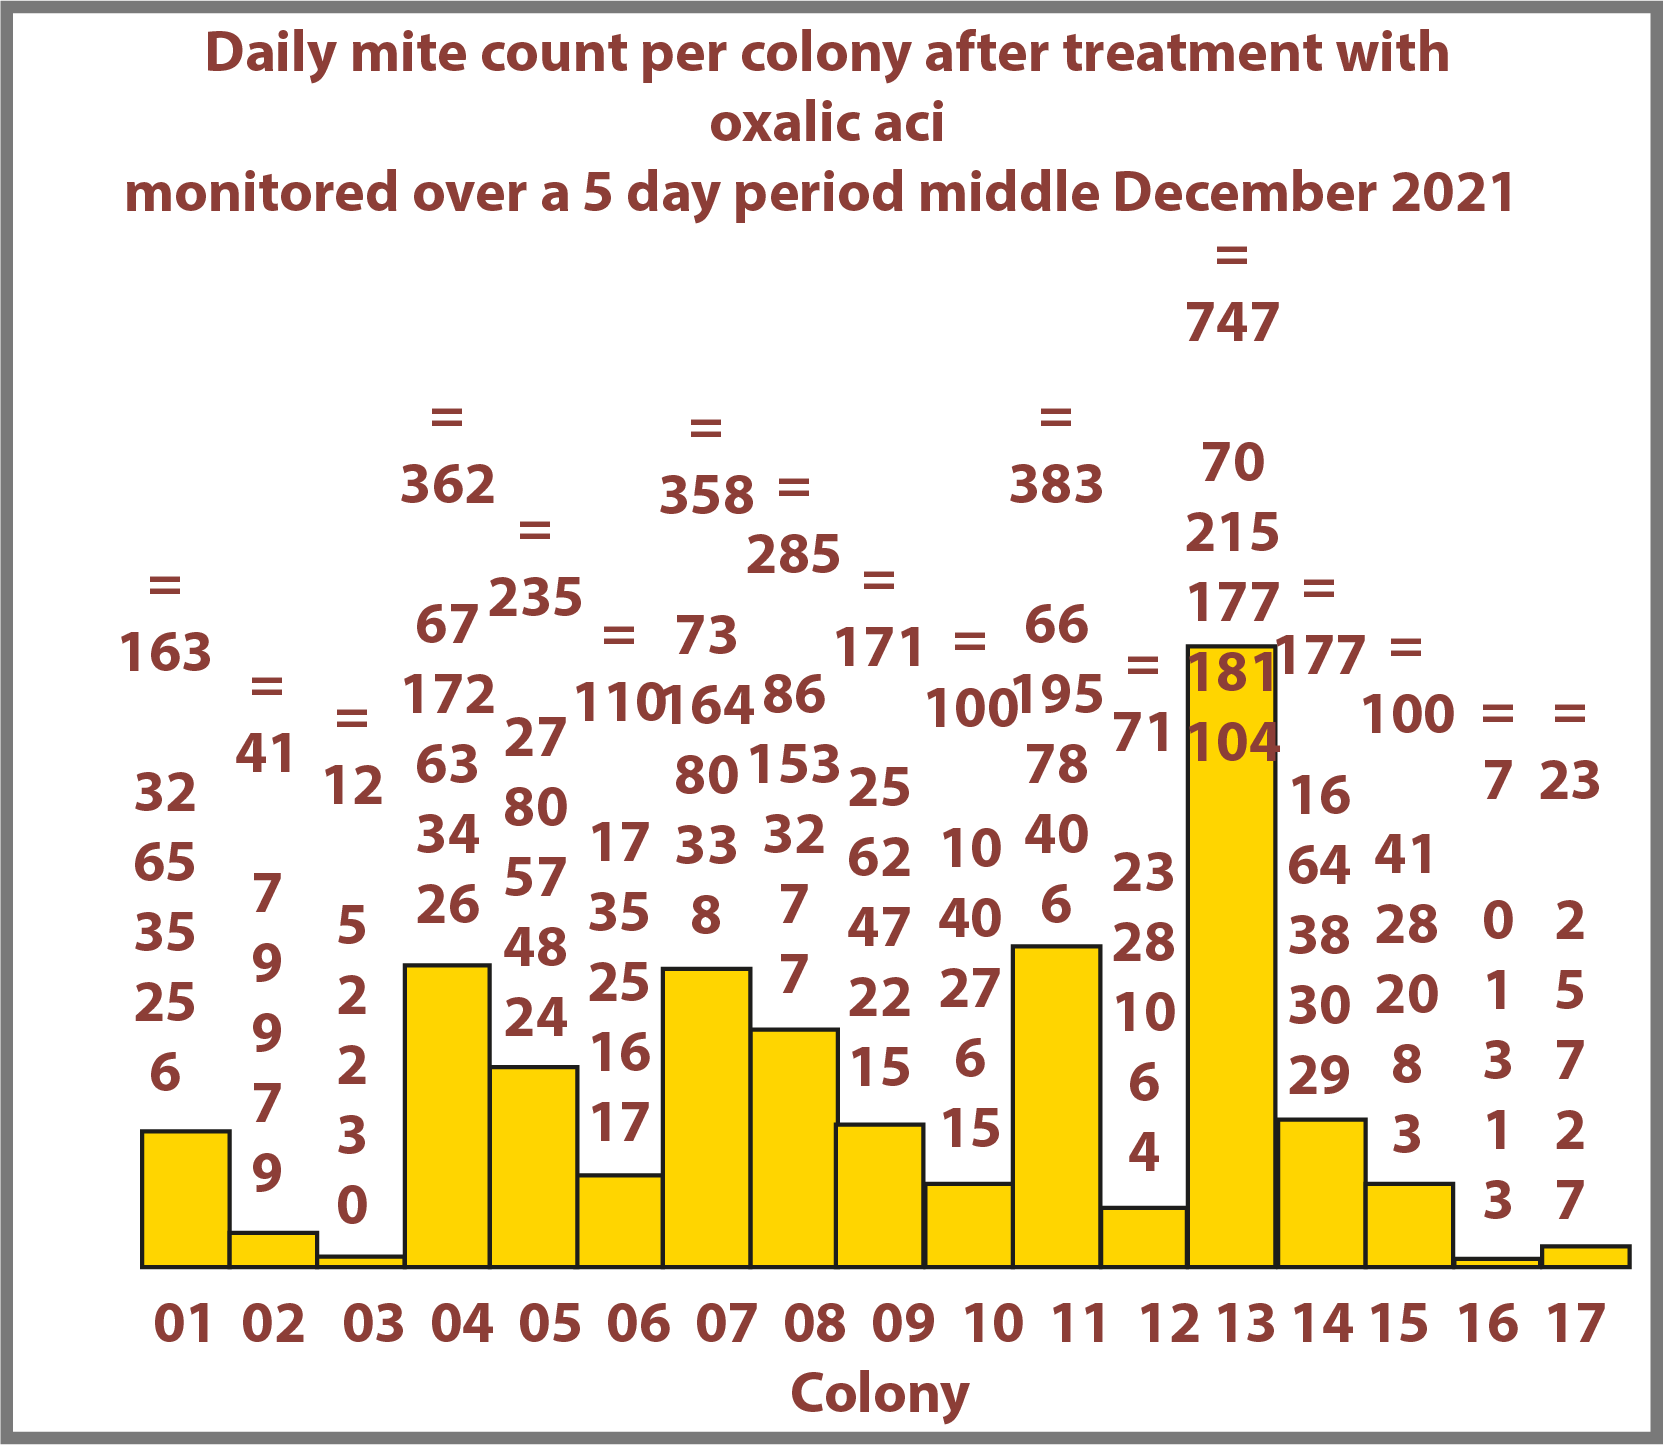
The natural mite drop for 17 colonies this year was monitored over a 5 day period in middle December just prior to treatment with oxalic acid.
The bar chart on the right shows the daily mite count after treatment with oxalic acid over the 5 day period for the 17 colonies.
The natural mite drop for 17 colonies this year was monitored over a 5 day period in middle December just prior to treatment with oxalic acid.
The bar chart on the right shows the daily mite count after treatment with oxalic acid over the 5 day period for the 17 colonies.